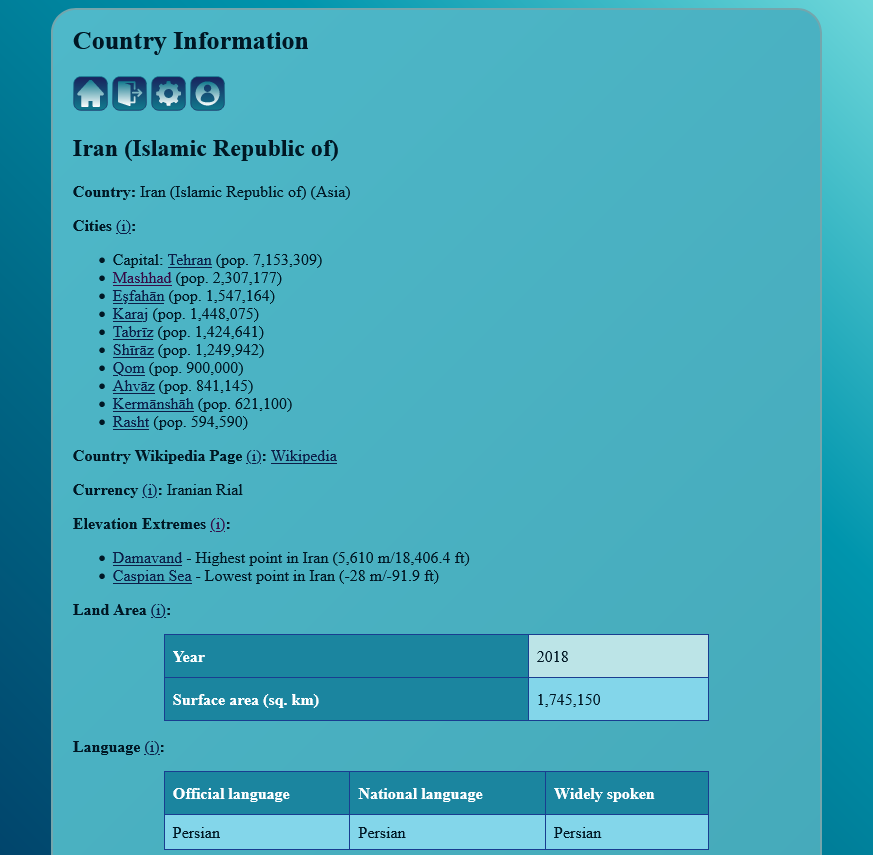
Progress is being made on the database. Of course, it takes a lot of time, as expected. One of the things that is interesting about the process is how I end up organizing the data. Most recently, I imported elevation extremes into the database. At first, I had thought about just "highest elevation - X", "lowest elevation - Y". However, I realized that these are locations, and I have a setup built to handle that. Since this database was originally to organize travel (both places to see and plane tickets, etc), I had set up some tables to hold information about places to visit. Of course, a place to visit can have all kinds of attributes, like an address, a phone number, or a website. By adding "elevation" into this list of possible attributes, I was suddenly able to use it for the elevation extreme information. So, instead of just being "highest elevation in Afghanistan: 7492 m", it is now "Noshakh - Highest point in Afghanistan (7,492 m/24,581.3 ft)". Much more interesting!
Want to see for yourself? Here is a screenshot (click to make it bigger).

I'll probably need to separate the data out into pages that handle economics, quality of life, and political climate (or something like that), because they are getting a bit long, and I don't want the information to be overwhelming.
Want to see for yourself? Here is a screenshot (click to make it bigger).
I'll probably need to separate the data out into pages that handle economics, quality of life, and political climate (or something like that), because they are getting a bit long, and I don't want the information to be overwhelming.
Previous: Part 8 - On The Subject Of Evacuations | Next: Part 10 - Really Great Data